FORMATTING GRAPHS
CONTENT
- Changing Chart Type
- Adding and Editing Charts
- Formatting a Chart
Changing Chart Type
After creating a chart, you can change it to the type you want. The type you choose depends on how you want to present your data.
- Select the chart
- Within the chart, click the right mouse button OR
- Click on insert on menu bar
- Click on change Chart type
- Under Chart Type, list click to select the desired chart type (e.g, Column, Bar, Line, etc). Under Chart sub-type list, click to select the chart sub-typed desired. You can view the chart sample by pressing it and hold to view sample button.
- Click on OK when satisfied.
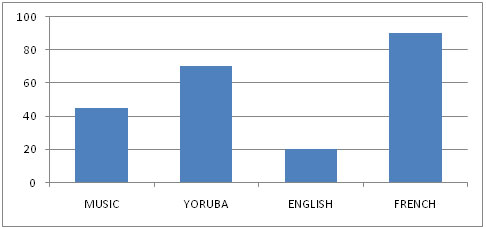
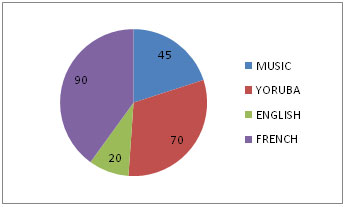
Changing from histogram to pie chart using the same data
Adding and Editing Charts
Once you have created a chart, you can add more chart data series or copy additional chart data series from a worksheet or another chart. Microsoft Excel offers a variety of ways to edit your chart data
You can change a chart data series by:
- Adding a chart data series to a chart
- Adding or removing more data point to the existing chart data series.
You are viewing an excerpt of this lesson. Subscribing to the subject will give you access to the following:
- NEW: Download the entire term's content in MS Word document format (1-year plan only)
- The complete lesson note and evaluation questions for this topic
- The complete lessons for the subject and class (First Term, Second Term & Third Term)
- Media-rich, interactive and gamified content
- End-of-lesson objective questions with detailed explanations to force mastery of content
- Simulated termly preparatory examination questions
- Discussion boards on all lessons and subjects
- Guaranteed learning