GRAPHS OF TRIGONOMETRIC RATIOS
CONTENT
1. Graphs of:
(i) Sine \( 0^o ≤ x ≤ 360^o \)
(ii) Cosine \(0^o ≤ x ≤ 360^o \)
2. Graphical solution of simultaneous linear and trigonometric equations.
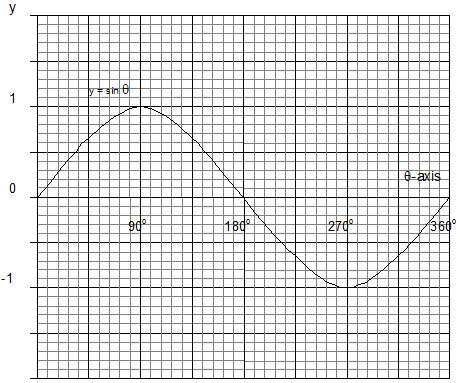
THE GRAPH OF \(y = \text{Sine } 0^o ≤ x ≤ 360^o \) The graph of \(y = sin θ\) is drawn by considering the table of values for \(sin θ\) from \(θ = 0^o\) to \(θ = 360^o\)at intervals of \(90^o\) as shown in the table below.
| \(θ\) | 0o | 90o | 180o | 270o | 360o |
|---|---|---|---|---|---|
| \(y = sin θ\) | 0 | 1 | 0 | -1 | 0 |

THE GRAPH OF \(Y= cos θ\) for \(0^o < θ^o < 360^o\)
The graph of \(y = cos θ\) is also drawn by considering the table of values for \(cos θ\) from \(θ = 0^o\) to \(θ = 360^o \)at intervals of \(90^o\)as shown in the table below.
You are viewing an excerpt of this lesson. Subscribing to the subject will give you access to the following:
- NEW: Download the entire term's content in MS Word document format (1-year plan only)
- The complete lesson note and evaluation questions for this topic
- The complete lessons for the subject and class (First Term, Second Term & Third Term)
- Media-rich, interactive and gamified content
- End-of-lesson objective questions with detailed explanations to force mastery of content
- Simulated termly preparatory examination questions
- Discussion boards on all lessons and subjects
- Guaranteed learning