GRAPHS
CONTENT
- Definition of Graph
- The Cartesian Plane (constructing Cartesian plane; coordinate/ordered pair; choosing scales; plotting points on a Cartesian plane)
- Graphs of Linear Equations
- Plotting Graphs from Table of Values
Definition of Graph
Graph is a picture of numerical data. A familiar example is the representation of numbers on the number line. The positions of the number on the line are called points.
The Cartesian Plane
This is a plane surface with axes drawn on it. The Cartesian is derived from a French philosopher and mathematician who worked out the possibility of presenting geometry in a numerical form. His full name is Rene Descartes, hence the name Cartesian.
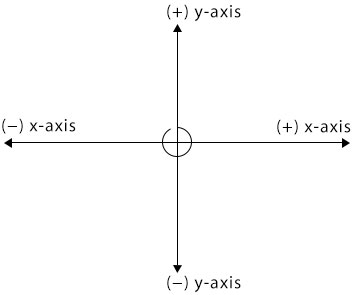
We describe a point on a Cartesian plane by two numbers say (x, y) called coordinates. x is the distance of the point from vertical line called y-axis and y is the distance of the point from horizontal line called x-axis. The figure below illustrates it more.
You are viewing an excerpt of this lesson. Subscribing to the subject will give you access to the following:
- NEW: Download the entire term's content in MS Word document format (1-year plan only)
- The complete lesson note and evaluation questions for this topic
- The complete lessons for the subject and class (First Term, Second Term & Third Term)
- Media-rich, interactive and gamified content
- End-of-lesson objective questions with detailed explanations to force mastery of content
- Simulated termly preparatory examination questions
- Discussion boards on all lessons and subjects
- Guaranteed learning